With so many platforms, it’s hard to know which one to choose. Managing relationships with multiple publishers is cumbersome and it can be hard to track the right metrics to know what’s working and what’s not. To solve that challenge, Flip, our performance OTT platform, provides a smarter way to buy, manage, and optimize OTT campaigns.
COO, David Zapletal, was recently featured in Martech Zone, where he explained the numerous advantages Flip offers advertisers and agencies. Here’s a recap of what he had to say:
Through extensive industry partnerships, brands and agencies get direct access to every premium OTT publisher to maximize audience reach. Because there’s no middleman, brands get the most efficient pricing possible, creating higher ROI and return on ad spend (ROAS). And because the entire OTT strategy is managed within Flip, there’s no need to hassle with multiple vendor relationships or contracts. It’s simple, consolidated, and efficient.
You can check out David’s full article on Martech Zone. To learn more about Flip’s capabilities, speak with a member of our team—and be sure to follow us on LinkedIn and Twitter for the latest updates.
VP of Business Development & Strategy, Ben Brenner, was recently featured in Toolbox Marketing, where he explained the numerous advantages Flip offers advertisers and agencies. Here’s a look at what he had to say:
Through extensive industry partnerships, brands and agencies get direct access to every premium OTT publisher to maximize audience reach. Because there’s no middleman, brands get the most efficient pricing possible, creating higher ROI and return on ad spend (ROAS). And because the entire OTT strategy is managed within Flip, there’s no need to hassle with multiple vendor relationships or contracts. It’s simple, consolidated, and efficient.
For more insights, you can check out the full piece on Toolbox Marketing. For more information, speak with a member of our team—and be sure to follow us on LinkedIn and Twitter for the latest updates.
Ad spending on CTV platforms continues with a projected increase of advancements and opportunities in the over-the-top (OTT) and connected TV (CTV) advertising space. As consumer viewing habits continue viewing streaming services ad dollars continue to migrate toward these channels as well.
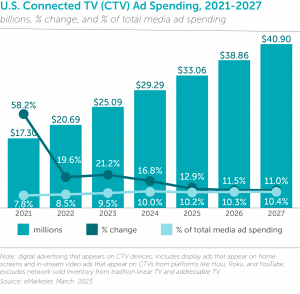
The industry built tools to better target streaming audiences and measure their viewing behaviors, with the goal of providing the most compelling ad opportunities for marketers looking to connect with valuable consumers. Making up 10% of all digital ad spending, CTV ad spending is expected to reach $29.29b in 2024.1
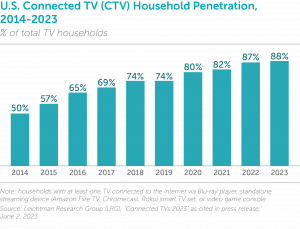
Connected TV penetration in U.S. households continues to grow, as more households acquire internet-connected devices to watch content.2
CTV’s ability to merge the often separated performance and brand marketing worlds is redefining the digital advertising space as we once knew it. Given the immense ad opportunities that CTV/OTT offers—including precise, digital-like measurability and a high-quality viewing environment and the valuable audiences it draws in—and the significant investment in these channels, advertisers and brands are increasingly focused on proving the effectiveness of their OTT campaigns.
Through next-generation CTV ad platforms, marketers can now understand the CTV exposure-to-outcome impact of their ads. Given the large investment in this media channel, attribution—the process of assigning credit for conversions to various marketing touchpoints along the customers’ journey—has become a must-have for growth and performance marketers. This information is critical to creating more effective ad campaigns and boosting revenue. In measuring conversions following ad exposure for CTV, it’s important to understand which exposure caused the conversion to take place. For example, if a person sees an ad for Jersey Mike’s Subs on CTV and grabs their phone to do a quick search for the nearest location, then clicks on the link and places an order. This behavior will be attributed to Google, while in fact the search and the sale were 100% inspired by the TV ad. This faulty attribution dynamic has played out for years, resulting in hundreds of billions of dollars in valuation being hijacked by last-click digital companies.
While some attribution models use basic analytics data, they only provide a template and often fail to account for important steps in the marketing funnel. While last-touch attribution has long been the “go-to” measurement method, marketers now need to explore different attribution methodologies, given the increasingly fragmented media space and evolving consumer journey. The digital ad space needs to advance our understanding of single-touch measurement models, as they assign 100% of conversion credit to only one marketing touchpoint and often focus on only the first or last interactions, and adapt more sophisticated methods of analysis for campaigns. By leveraging different attribution methodologies, marketers can gain more in-depth insights regarding ad effectiveness to drive future marketing decisions.
It’s important to understand that attribution is a journey and the consumer journey is ever-changing. Today, a person can be exposed to a brand’s ad across numerous platforms and devices before purchasing. In fact, in the modern age of marketing across platforms, devices, and channels, the typical retail consumer requires an average of 56 touchpoints before making a purchase.3 It is important to assign proper credit to each touchpoint so that marketers can determine where their budget should be spent.
Our award-winning proprietary Performance CTV platform matches and tracks OTT/CTV impressions across premium inventory sources to real-world events, including site visits, store location visits, subscriptions, app installs, form-fills, purchases, revenue, and more to provide a more granular look at the consumer journey. We know, deterministically, at the household level, when someone is exposed to an ad and then takes action—whether it be digitally or physically. With our platform, advertisers can analyze exactly what’s driving desired results among consumers using multiple attribution methodologies.
Our Performance CTV platform takes attribution a step further, measuring every single touch prior to a conversion. Powered by innovative technology, the platform allows users to toggle freely between four different attribution methodologies in real-time to see exactly which touchpoints are driving the most leads, sales, installs, or visits among consumers. Advertisers have the ability to shuffle the distribution of credit according to the following attribution methodologies:
First Touch: All conversion credit assigned to the first variables that the converter was exposed to.
Last Touch: All conversion credit assigned to the last variables that the converter was exposed to.
Time Decay: Credit weighted more heavily across variables that the converter was exposed to as said exposures approach conversion (aka credit increases as time to conversion decreases).
Linear: Credit evenly dispersed across all variables that the converter was exposed to.
Our Performance CTV platform is the one-stop-shop for advertisers and agencies looking to transform data into actionable items that can be leveraged and improved upon in the future. By measuring and assigning credit to different variables in your campaign, our platform determines the true impact of each of them on any KPI—providing a new standard in tracking, transparency, and results via comprehensive attribution insights. Our platform then uses these insights to inform its media buying with a bidder that moves the budget toward the highest-performing campaign variables—lowering CPAs, maximizing ROAS, and making a tangible impact on a brand’s bottom line. Expanding your attribution methodologies will not only help refine your budget strategy but will have a lasting impact on your current and future ad campaigns.
Sources:
CTV viewership has exploded. To take advantage of the channel’s surging audience, e-commerce and retail brands are making CTV a key part of their advertising strategy. CTV allows brands to apply an audience-first, data-driven approach to TV similar to other digital channels. However, as ad strategies continue to become more CTV-reliant, brands need greater clarity on performance and ROI. Our proprietary performance CTV platform, Flip, provides that clarity to e-commerce and retail advertisers.
Flip connects mobile location data with CTV ad impressions to help brands granularly understand campaign performance, attribution, and Return on Ad Spend (ROAS). Flip helps advertisers and agencies accurately and granularly measure CTV campaign effectiveness. The platform provides an easy-to-use dashboard that shows CTV buyers exactly which campaigns are working across which devices, publishers, demographics, and more – all in real time. Using proprietary software, Flip can tie ad impressions to app installs, cart amounts, and site visits. The platform can even match a CTV impression to an in-store visit when that device shows up in a physical store, uniquely tying digital impressions to physical actions. With its full-funnel attribution capabilities, Flip traces every CTV impression to a conversion and sheds light on ROAS as CTV investments grow.
“With Flip, we’re able to connect real-world sales events to CTV impressions to let retailers know, definitively, that someone was exposed to their CTV ad, and then visited their site or made a purchase. We’ve set our sights on elevating CTV to a fully accountable performance media channel — driving real-world results for our clients by allowing them to activate against their data or third-party data to maximize return on ad spend. Flip has answered the call for a new benchmark for measuring campaign success, even on platforms that don’t have a lot of transparent reporting, and we’re thrilled to extend it to e-commerce and retail brands.”
– Head of Activation at Agency Partner
Flip is the cornerstone of our full CTV/OTT offering, helping digital ad buyers optimize targeting, tracking, and campaign management across multiple platforms and devices. Now, e-commerce and retail clients can leverage and unlock real-time insights, measure the true impact of campaigns and optimize to drive results. With Flip, e-commerce and retail marketers can:
“As the industry aims to keep pace with consumer demand for personalized experiences in an economic environment where every dollar counts, measurement and performance have become critical metrics for retail advertisers. We’re ecstatic to extend Flip’s capabilities in the retail and e-commerce sector and remain committed to providing a holistic solution by which advertisers can unlock and optimize real-time insights, measure campaign effectiveness, and drive valuable results.”
– Matt Sotebeer, Chief Strategy Officer at Digital Remedy
To learn more about Flip, visit www.digitalremedy.com/flip or speak to one of our team members to book a demo and see the platform in action.
Digital Remedy first started using Google Cloud services in 2019, with the goal of improving efficiency by streamlining company processes and consolidating applications. Before migrating to Google Cloud, there were different communications platforms and processes in place across multiple teams within the organization. Google Cloud provided the technology that allowed Digital Remedy to unify its business to host all of the organization’s applications under one roof—eliminating the need for middleware and the hassle of having to connect multiple programs—ultimately, supporting the creation of our award-winning, in-house ad solution, Flip, using future-proofed infrastructure.
As a media execution company, the real milestone was adding comprehensive attribution and measurement to the Flip platform, which is built solely on Google Cloud. Flip tracks and matches OTT/CTV impressions across premium inventory sources to conversion events, including site visits and purchases, store location visits, subscriptions, app installs, and more—providing marketers with a comprehensive look at the consumer journey to determine what’s driving desired actions in real time. In fact, Flip was named “Best New TV/Streaming Ad Sales Program/Product” in 2021 by the Digiday Video & TV Awards and was a finalist for “Best Connected TV Platform” in 2022.
“Google Cloud is exactly what we were looking for—scalable, reliable, and great performance. We were able to seamlessly scale our product from prototype, to MVP, to full launch—processing over a hundred terabytes of data daily all while maintaining impressive reliability and performance.”
– Tony Pascal, SVP, Product & Technology
During conception, the Digital Remedy Team was able to collaboratively experiment and test various processes, leveraging key learnings and insights to drive future decision making. Since its inception, Flip has run completely on Google Cloud. As part of the daily business operations on the Flip platform, billions of ad impressions and conversion events are served and measured, each of which potentially affects hundreds of downstream aggregate metrics. To enable clients to measure audience engagement and track campaign efficiency, Digital Remedy offers a variety of analytics tools and features within the Flip platform, including APIs and dashboards that can aggregate and display metrics in near-real-time.
The Digital Remedy Team is able to bridge many different media sources and data formats, including universal pixel data and first-party data directly from clients. This data is all cleaned and brought into BigQuery—Google’s serverless and highly-scalable data warehouse to support ad-hoc and batch queries—where it powers our reporting and multi-touch attribution (without the need of third-party access to data). This is also leveraged to help Digital Remedy automate the campaign optimization process, creating better outcomes and boosting performance for clients. Google Cloud has enabled Digital Remedy to simplify and centralize processes that previously required disparate products and services to accomplish the same or similar result.
At a high level, Flip requires data to be ingested from multiple sources, such as demand-side platforms (DSPs), event data recorded by internal applications, and occasionally, first- (think: data collected directly by a brand from their customers) and third-party data (think: data from a data aggregator, most likely from numerous partners).
With Cloud Composer’s reliability and flexibility, the Digital Remedy team was able to do away with the many products and services previously required to properly handle the ETL pipelines responsible for loading data into BigQuery, the company’s primary data warehouse. BigQuery provides an extremely fast and scalable data warehouse solution that can easily handle working with the terabytes of data stored within it. Composer’s ability to work with the BigQuery API has not only allowed the company to automate sections of the ETL pipeline within BigQuery datasets but also the exporting of data for the purposes of reporting, visualization, and optimization of our ad campaigns.
Google Cloud provides Digital Remedy with an overall, scalable tech architecture that consistently supports the company’s growing business. Performance/operations highlights include:
Google Cloud has provided Digital Remedy with the foundation and technology to significantly improve the performance and reliability of its infrastructure while future-proofing the company’s data and analytics capabilities. The automation of operations has empowered the product and development teams to focus on developing and implementing data-driven ad products and consultative solutions to significantly grow the organization’s business. Since its launch, Flip has run consistently and, thanks to Google Cloud, can continue to scale with plenty of headroom to pivot on industry evolutions and external parameters, such as legislation or data/privacy changes. Digital Remedy is excited to continue leveraging Google Cloud to advance the Flip solution, optimize its offerings, and remain competitive in the ever-changing ad tech industry.
To learn more about Flip, speak to a member of our team today.
In Part 1 of our Intro to Incrementality series, we went through the basics of incrementality analysis. We talked about our two groups, test (or exposed) and control (or holdout), and how this type of analysis measures the lift caused by a specific variable of one over the other, thereby attaining a true measure of that variable’s impact. In Part 2, we homed in on that control (or holdout) group and explained exactly how to go about creating that group through ghost bidding in a way that avoids skewing the incrementality analysis. So, we’ve covered the basics and we’ve made sure that by the time we get to our incrementality results, we can trust that there’s no skew or bias.
In this last installment, we will discuss the final, and perhaps most important, part of this process: putting this analysis to work in real time. To get to the heart of it, let’s look back on our initial basketball example:
An NBA basketball team has two players who both make 40% of their foul shots. The team wants to improve that percentage, so it decides to hire a shooting coach. It designs a test to evaluate that coach, and assigns him to only one of the two players. Both players are told to do everything else they had been doing, exactly as they had been doing it. For instance, they’re told to spend the same amount of time in the gym, keep asimilar diet, and maintain their same weight. After a year, the player who worked with the shooting coach makes 80% of his free throws the following season, while the player not assigned the shooting coach makes 50% of his free throws.
While this example has been useful in demonstrating the basics of incrementality, the test (the player assigned the coach), the control (the player not assigned the coach), and the new variable (the coach), it neglects some crucial real-world implications.
For starters, if something appears to be working, it doesn’t necessarily benefit the team to wait a whole season to evaluate exactly how well it’s working. If that coach got assigned to the control player mid-way through the season, the results might differ, but it’s quite likely the team could have boosted two players’ free throw percentage instead of one. It’s also worth taking a look at exactly what the coach is doing. Is it just the extra repetitions demanded by the coach that are causing the improvement? Is it an adjustment in form? Is it some mental component or confidence boost? Finally, and most importantly, this coach represents an investment. And the team is paying. The team has to determine if that investment is justified by the incremental improvement. If it is, it has to then determine whether should it increase that investment, and how. Our example simplifies a problem that, in basketball or marketing, is quite messy. The point of this final installment is to discuss cleaning up that mess.
1. In marketing, incrementality analysis should be ongoing and in real time. Marketers don’t have an unlimited budget or the luxury of conducting tests in a vacuum. It’s important to note that what incrementality results look like after two weeks might be different than what they look like after two months, but that doesn’t invalidate the two-week results. It’s a continual process of data collection and analysis that should inform decision making. What decision making? We’ll get there shortly.
2. Incrementality analysis is often conducted at the media type level. In our former marketing example, we discussed determining the incremental impact of adding a CTV campaign to a larger marketing mix. The reality is that the CTV campaign very likely consisted of several streaming services, maybe Sling, Hulu, and Pluto, and several creatives, maybe a:30 second creative and two :15 second creatives, across more than one audience, maybe an intent-based audience and a demographic-based audience. When we conduct this type of analysis, it’s important to get more granular than just the overall media type to unearth additional valuable insights.
3. This will come as no surprise to anyone, but paid media costs money. We cannot, and should not, treat this analysis as independent of cost.
How do we put this analysis to work in real time, granularly, and factoring in cost? We apply it to campaign optimization. Here’s another marketing example:
A brand decides to add a $1k CTV test to their marketing mix that previously consisted only of search and social media campaigns. The brand’s goal is to optimize toward the lowest cost-per-checkout (CPC) possible for its CTV campaigns. The brand has only one creative and is testing only one intent-based audience, but it doesn’t want to put all its eggs in one basket, so it decides to test three publishers, Sling, Hulu, and Pluto TV.
Most performance CTV vendors don’t report incremental conversions, so the brand observes the following checkouts and cost-per-checkout across the variables in the CTV campaign.
Any brand that sees those results would think: “well, it looks like Sling is the best, we should put more budget there and less budget in Hulu and Pluto TV”—and, in a vacuum, the brand would be absolutely correct. But media doesn’t work in silos, it works across silos, and the brand is also running search and social, plus, it’s got all this organic demand it worked so hard to build up.
The brand, knowing this, decides to add incrementality analysis as an additional data point, and it finds that Sling’s incrementality percentage is 10%, Hulu’s is 80%, and Pluto TV’s is 50%. In other words, it finds that 90% of conversions recorded from Sling would have happened despite those Sling exposures, 20% of conversions recorded from Hulu would have happened despite those Hulu exposures, and 50% of those conversions recorded from Pluto TV would have happened despite those Pluto exposures.
This is worrisome and tricky when it comes to future budget allocation. What the brand is seeing is a commonplace occurrence in the marketing world: conversions reported by platforms are duplicative because each platform the brand operates in works only with the media it runs. So the brand’s CTV vendor takes credit for its social media conversions, the brand’s search vendor takes credit for its CTV conversions, and so on.
But the brand has a secret weapon: incrementality-informed optimization. Instead of using only CPA metrics, the brand can, very simply, apply the incrementality analysis to the cost-per-checkout and the result is a new metric: cost-per-incremental-checkout (iCPC). By multiplying the number of checkouts and the incrementality percentage, the brand unearths the below results:
The takeaway? Without incrementality analysis applied to the brand’s performance numbers, it would have been optimizing its CTV campaign in a way that was actually counter to its bottom line, toward conversions that would have happened anyway. By adding this additional analysis, it can actually see it would be best served spending more on Hulu, and that the top performer from only a CPC standpoint (Sling) actually finishes well behind the top performer from an iCPC standpoint (Hulu).
As brands get smarter with their budget allocation across and within media types, incrementality analysis becomes a crucial stepping stone on the path to profitability and cross-channel ROAS.
Flip, our performance CTV platform, not only offers incrementality analysis but also allows brands the option to leverage incrementality-informed optimization strategies, ensuring that their CTV dollars are getting put to work efficiently within a cross-channel media mix. To learn more speak to a member of our team today.
In our first Intro to Incrementality piece, we explained what incrementality analysis is and how marketers can use it to make more informed decisions about what success means for their media campaigns. We mentioned how, at the very heart of this analysis, there is a comparison between two groups:
In this part of our incrementality series, we talk specifically about that second group, diving deeper into how to create a control group and what it should be composed of for unskewed analysis.
Remember our basketball example? Here’s a quick refresher:
An NBA basketball team has two players who both make 40% of their foul shots. The team wants to improve that percentage, so it decides to hire a shooting coach. It designs a test to evaluate that coach and assigns him to only one of the two players. Both players are told to do everything else they had been doing, exactly as they had been doing it. For instance, they’re told to spend the same amount of time in the gym, keep a similar diet, and maintain the same weight.
Player A: 40% of free throws ┃ Player B: 40% of free throws
After a year, the player who worked with the shooting coach makes 80% of his free throws the following season, while the player not assigned the shooting coach makes 50% of his free throws.
Player A: 50% of free throws ┃ Player B: 80% of free throws
There are some very important concepts embedded in this example but two are chief among them. First, both players make 40% of their shots. The observed behaviors of both groups are similar, if not the same. Second, everything else going on—except the shooting coach—remains the same. No after-practice shots allowed, no extra weight room, etc. Allowing additional variables into the equation creates noise that can skew or obscure incrementality analysis.
Bringing this back to marketing, we’re left with this challenge: how can we create a control group where the observed or expected behaviors match the exposed group, and how can we limit the noise around this analysis? Prior to 2020, there were three common methods for creating control (or holdout) groups for marketing and advertising campaign analysis:
Pick two similar markets, turn media or a certain type of media on in one market, leave it off in the other, and observe behavior in each. The issue with market A/B testing is that no two markets behave exactly alike, no two markets contain populations that are comprised of the exact same demographics and interests, and the background noise can reach dangerous levels.
Using existing technology and cookie, IP, or Mobile Ad ID (MAID) lists, agencies and advertisers were able to actively hold out randomly generated subsets of people from seeing ads. However, as soon as targeting is applied to the campaign, the analysis skews heavily toward the exposed group. For example, imagine you’re selling men’s running shoes and you want to run incrementality analysis. Your campaign is targeting men, but your randomly-generated control is observing men and women equally. Your exposed group is going to perform better because half the control group can’t even buy your product.
The exposed group, with all its relevant demographic and behavioral targeting, is served ads for the brand. Meanwhile, that same demographic and behavioral targeting is applied to a different group, and instead of ads for the brand, they’re served ads for public service or completely unrelated products or activities. The two groups remain separate and distinct but mirror each other in behaviors essentially (e.g. back to the basketball example: they both shoot 40% at the line). This allows us to see a much-less-skewed, noise-filled outcome of the incrementality test running.
The main drawback of PSA holdouts is that someone has to pay for that PSA ad to be served. Impressions don’t come free, and in order to run this analysis, impressions must actually be purchased to run PSA ads on, so a substantial portion of the advertising budget is going toward actively NOT advertising! Additionally, when a PSA is served, it actually prevents competitive brands from winning that same impression and possibly swooping in on a customer, which might be good for business but is very bad for statistics—and creates a skew toward the exposed group.
In 2020, a new method for creating a holdout emerged called ghost bidding, which allows media buyers to create a holdout by setting a cadence against individual line items or ad groups. The cadence dictates how often the buying platform will send an eligible bid into the control group, instead of actually bidding on the impression. So, at a ghost bid cadence of 20%, for every 5 impressions bid on, 1 user receives a “ghost bid”, or gets placed in a holdout group where it cannot receive ads for the duration of the campaign.
Because the ghost bid isn’t an actual impression, the ad space remains open and the “ghost bid” is free. Additionally, because it’s set against the line item or ad group itself, all the targeting matches the exposed group exactly and all optimization on the exposed group follows suit on the control group. If Millennial Urban Men are converting at a higher rate and receiving more budget in the exposed group, they’re also receiving more ghost bids, making sure the composition of the control follows suit.
Ghost bidding addresses the pitfalls of market tests, random samples, and PSA’s while remaining inexpensive and relatively easy to implement. As a result, ghost bidding has become increasingly popular with sophisticated marketers and media buyers. It is Digital Remedy’s preferred method for creating holdouts for our Flip product.
In our next piece of this series, learn why optimizing incrementally is a crucial capability for brand marketers and agencies looking to drive tangible bottom-line results. Can’t wait? Check out our full insights report or speak to a member of our team today.
Welcome to the first part of our Intro to Incrementality series, which uses real-world examples to explain how incrementality analysis and incremental lift can help brands and agencies isolate the effect of a particular media type or campaign variable in order to accurately measure its impact. Warning: this post involves (basic) math.
As a marketer, the line between correlation and causation can get very blurry. In the modern ad landscape, brands run ads across many different media channels—from paid search to OTT/CTV, display to streaming audio. Customers are often exposed to several different media types—and several different ads within each media type—before making a purchase or converting. Therein lies the challenge: How do marketers know which specific ads, or which specific campaigns actually drove the conversion, when so many other campaigns and ads are running concurrently? How do they separate an individual channel from the rest, or from their own organic or native demand?
Enter incrementality. At its heart, this type of analysis compares a control (or unexposed group) against a test (or exposed group), measuring the difference between the two groups. The test group is an apt name, we’re introducing a new variable into the equation, whether that variable is a campaign, a publisher, a creative, or something else, and our hypothesis is that this variable will result in additional conversions. To measure that hypothesis, we need a baseline for what “additional” means, and that’s where the holdout group comes in—the holdout group establishes the floor above which we wish to measure.
Let’s use a non-marketing example to understand how this might work. An NBA basketball team has two players who both make 40% of their foul shots. The team wants to improve that percentage, so it decides to hire a shooting coach. It designs a test to evaluate that coach, and assigns him to only one of the two players. Both players are told to do everything else they had been doing, exactly as they had been doing it. For instance, they’re told to spend the same amount of time in the gym, keep a similar diet, and maintain their same weight.
2020–21 Season:
Player A: 40% of free throws ┃ Player B: 40% of free throws
After a year, the player who worked with the shooting coach makes 80% of his free throws the following season, while the player not assigned the shooting coach makes 50% of his free throws. In this test, we have a new baseline (or control/holdout) of 50%, and a new variable introduced in the shooting coach, resulting in a new test result of 80%. Both players improved, but one player improved more, so how do we measure that incremental improvement and attribute it to the shooting coach?
2021–22 Season:
Player A (control): 50% of free throws ┃ Player B with Coach (test): 80% of free throws
To measure the impact of the shooting coach, we want to answer two questions:
1. After introducing the shooting coach, how much more likely is Player B to make a foul shot? We call this incremental lift. To answer this question, we use the formula:
(test: 80% – holdout: 50%) / holdout: 50%
The result is 60%
A lift of 60% equates to a multiple of 1.6. In other words, Player B is now 1.6 times as likely to make his foul shots. So, we can accurately say that Player B, after working with the shooting coach, was 60% more, or 1.6 times as likely, to make a free throw than he was without working with the shooting coach.
60% more likely to make a free throw
2. Of all the free throws Player B now makes (that new 80% figure), what percentage can we attribute to the shooting coach? The formula for incrementality is:
(test: 80% – holdout: 50%) / test: 80%
This result is 37.5%
Leveraging incrementality, we can determine the shooting coach is directly responsible for 37.5% of the shots made after he began working with the player,—that 37.5% of the shots would have otherwise been missed if Player B and the coach never worked together.
Let’s bring this concept back to marketing. Let’s replace the NBA players with a brand running search and social media campaigns. It observes two subsets of its consumers who are exposed to search and social media campaigns and finds that both groups, who resemble each other behaviorally and demographically, convert at .1%, or, put another way, of those consumers observed who were exposed to search and/or social media, one in every thousand buy its product.
The brand has a hypothesis: if the brand introduces CTV advertising into its media mix, the conversion rate will increase. In this example, OTT/CTV campaigns are standing in for our shooting coach.
So the test begins: the brand starts running OTT/CTV campaigns on one of the two subsets of consumers. For both groups, it keeps social media and search spending and campaigns static. At the end of the campaign, the brand analyzes the data and discovers that the group who was exposed to OTT/CTV ads in addition to search and social media ads converts at .2% (test) while the group exposed only to search and social media ads converts at .15% (holdout)
Using incremental lift analysis, we can determine that OTT/CTV was responsible for a 33.33% incremental lift in purchases
(test: .2% – holdout: .15%) / holdout: .15% = 33.33%
and has an incrementality percentage of 25%
(test: .2% – holdout: .15%) / test: .2% = 25%
In other words: Those exposed to the brand’s OTT/CTV campaigns are 33.33% more—or 1.33 times as—likely to purchase than those not exposed. It means OTT/CTV campaigns are directly responsible for 25% of all conversions recorded.
Incrementality aims to answer the question, would this person have converted otherwise if not exposed to a particular campaign or campaign variable? Just like the shooting coach, the OTT/CTV campaign provided a needed boost in conversion rate. By using incrementality analysis instead of simply looking at the new conversion rate, or the new number of conversions, the brand is able to isolate and measure that boost and understand more clearly the impact of every new variable it introduces into its marketing mix.
Coming up in our next post, we’ll discuss how brands and agencies can create and leverage holdout (or control) groups. Can’t wait? Check out our full insights report or speak to a member of our team today.
The CTV/OTT space presents many advantages for B2B marketers, including clear targets, ideal buyer profiles, and precise targeting strategies. However, B2B marketers are feeling increased pressure to prove the value of CTV/OTT in reaching their target audience and without the right digital attribution, it can be tough to prove success and maximize return on ad spending (ROAS).
TJ Sullivan, SVP of Sales at Digital Remedy was recently featured in MarketingProfs, where he discussed digital attribution in the OTT/CTV space. Specifically, TJ outlined five ways to succeed with CTV/OTT, improve ROAS, and boost your bottom line:
Multi-touch attribution for CTV/OTT gives you the ability to see the customer journey beyond just first- and last-touch—which is especially crucial for B2B marketers looking to understand the full customer journey.
CTV/OTT metrics let you dive into the details to understand which tactics moved the needle with the right people in the right way. Factoring in incrementality lets you see the real picture by taking all attributed conversions and filtering out ones that the campaign didn’t directly drive.
Good B2B marketers know how to recognize buy signals—those actions and behaviors that indicate a prospect is ready to buy. Being able to recognize those “telling” signals and match them to the strategy—optimizing creative, targeting, and placement to drive those signals—is a key advantage in CTV/OTT advertising when it’s done right.
The beauty of CTV is that it enables real-time optimization of ad buys in comparison with Linear, which means you are able to move your budget toward the publishers, creatives, dayparts, audiences, and geographies that are working to drive the most action to fully maximize your spend.
When you combine multi-touch attribution with real-time performance metrics, it creates a powerful platform to fully optimize targeting and content delivery.
While it may be relatively new to some marketers, multi-touch attribution must become a top priority, as it allows you to not only identify the specific touchpoints throughout the consumer journey that triggered the desired action, but also leverage valuable performance insights to optimize future campaigns. With the Flip OTT performance platform, Digital Remedy is making it accessible and simple for brands and marketers at all levels to win in the OTT/CTV space. To learn how you can leverage alternative attribution methodologies within our award-winning CTV platform, visit www.digitalremedy.com/flip.
Check out TJ’s full insights on MarketingProfs and be sure to follow Digital Remedy on LinkedIn and Twitter for the latest updates.
With its precise targeting and direct attribution capabilities, OTT/CTV advertising has become a powerful new performance-based opportunity for marketers. As more and more brands have discovered the potential to effectively reach high-value audiences and measure return on ad spend (ROAS), spending on OTT/CTV advertising has skyrocketed and is expected to surge 40% this year to over $14.4b—more than doubling by 2024 to nearly $30b.
With precision targeting and deterministic measurement, performance CTV provides a unique opportunity for marketers to reach highly-engaged audiences. But for marketers who are new to the channel, especially those who are more familiar with linear TV, OTT/CTV might feel a bit disorienting. Our own, Ben Brenner, VP of Business Development & Strategy, was recently featured in Street Fight Magazine, where he discussed some tips for getting started and how to fully maximize your performance CTV strategy. Here’s an overview of what he had to say:
Unlike linear TV, where an ad buy will stay in rotation for a fixed period of time, CTV buys can (and should be) much more dynamic, fluid, and iterative. With CTV, it’s much easier to launch, adjust, and optimize targeting throughout your campaign’s flight.
With CTV, you can use first-party data to target both existing and prospective customers in a variety of ways, including using your CRM list to target existing customers with new product launches, excluding existing users to reach only new audiences for prospecting campaigns, and using known user data to surface look-a-like consumers to connect with new high-value prospects.
There is a huge variety of third-party data sources available that can help to target ads on CTV, including data on purchases, viewership, search and browser history, location, in-store visits, and more.
With CTV, you can get full attribution visibility—when someone makes a purchase, you can look back to see which ad they saw on what platform, during which program, and at what time of day. By understanding this sequence and the attributes of every ad exposure, not just the last one, marketers can fine-tune ad targeting and delivery to maximize conversions and identify new users who are most likely to convert.
Look for a partner who can offer both first- and third-party data integrations, directly access a wide variety of streaming publishers, and provide both attribution tracking and real-time optimization, with complete transparency into the process so there are no surprises.
Check out the full article on Street Fight and be sure to follow us on LinkedIn and Twitter for the latest Digital Remedy updates. Interested in learning more about performance CTV? Watch our on-demand webinar or speak to a member of our team.