In Part 1 of our Intro to Incrementality series, we covered the fundamentals-measuring incremental lift by comparing test (exposed) and control (holdout) groups. In Part 2, we explored how to create accurate control groups using ghost bidding to eliminate bias and avoid skewing incrementality analysis.
Now, in this final installment, we’ll show you how to apply incrementality analysis in real time to optimize your campaigns, improve ROI, and make smarter marketing decisions. From uncovering granular insights to factoring in cost, incrementality isn’t just about measurement—it’s about actionable optimization.
Let’s revisit our basketball analogy a final time: An NBA team hires a shooting coach for one of two players, both of whom start with a 40% free throw success rate. After a year, Player B—who worked with the coach—improved to 80%, while Player A improved naturally to 50%.

This analogy illustrates the basics of incrementality: the test group (Player B), the control (Player A), and the new variable (the coach). However, it neglects some real-world complexities:
Marketing is no different. Incrementality analysis is messy, nuanced, and ongoing. Let’s clean up the mess.
To make incrementality actionable, brands and agencies must embrace three key principles:
1. Real-Time Analysis
Incrementality isn’t a one-and-done exercise. Marketers don’t have unlimited budgets or the luxury of testing campaigns in isolation. Real-time analysis allows brands to adjust strategies dynamically, optimizing performance as results unfold.
For instance, incrementality after two weeks may differ from results after two months-but early insights can still drive valuable decision-making.
2. Granular Insights
Broad media type analysis (e.g., evaluating all CTV campaigns together) can only tell you so much. Granular insights-breaking down performance by publisher, audience, or creative-are essential for actionable optimization.
For instance, instead of asking whether CTV works, ask which publishers (e.g., Hulu vs. Pluto TV), audiences (e.g., intent-based vs. demographic-based), or creatives (e.g., :15 vs. :30-second spots) deliver the most incremental value.
3. Money Matters
Incrementality analysis is incomplete without factoring in cost. Metrics like cost per incremental action (iCPA) and incremental return on ad spend (iROAS) go beyond traditional cost per action (CPA) and last-touch attribution to ensure your budget is allocated toward the most effective tactics.
A brand adds a $1k CTV test campaign to its marketing mix, which previously included only search and social media. The goal is to optimize to the lowest cost per action (CPA). The campaign tests one creative, one intent-based audience, and three publishers: Hulu, Sling, and Pluto TV.
Here’s the performance data from the CTV campaign based on checkouts and CPA:

At first glance, Sling appears to be the top performer due to its low CPA. But incrementality analysis provides a different perspective:
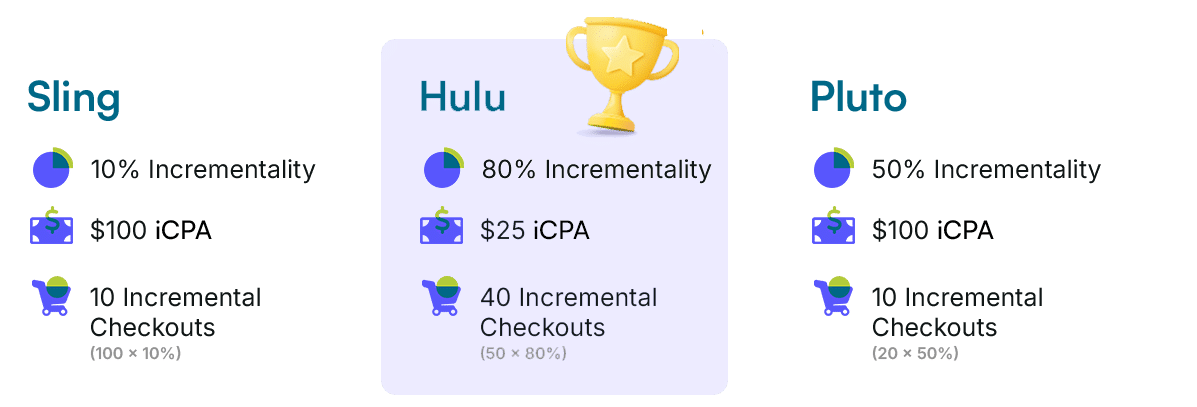
The takeaway? Without incrementality analysis, the brand would have funneled more budget into Sling, optimizing its campaign in a way that was actually counter to its bottom line, toward conversions that would have happened anyway. By incorporating incrementality, it sees that Hulu delivers the lowest cost per incremental action (iCPA) and can reallocate budget accordingly.
This example highlights a common marketing pitfall: platforms and publishers often overreport conversions by attributing them to their own channels, regardless of cross-channel interactions. Incrementality analysis cuts through this noise, giving marketers a clearer picture of which ads and channels drive true incremental results.
Using metrics like iCPA and iROAS ensures smarter budget allocation—not just within a single channel but across your entire media mix.
As brands and agencies become more strategic about their marketing budgets and cross-channel complexity continues to grow, incrementality analysis is no longer optional but essential. It doesn’t just track performance—it answers the fundamental question: Did this ad actually cause the action, or was it just along for the ride?
By working with a media execution partner that applies real-time, granular, and cost-aware optimization strategies, brands and agencies can ensure their media spend drives true impact on marketing performance and business results.
The Digital Remedy Platform not only offers incrementality analysis as a standard feature but also enables advanced ad optimization, ensuring every media dollar is strategically allocated to deliver measurable success.
Ready to make every dollar count? Speak with a member of our team today to learn how incrementality can revolutionize your marketing strategy.
Welcome to the first installment of our Intro to Incrementality series, where we’ll use real-world examples to explore how to uncover the true impact of your advertising campaigns. By isolating the effect of specific media types or campaign variables, incrementality analysis provides actionable insights into what’s driving performance–and what isn’t.
Warning: this post involves (basic) math.
In today’s crowded media landscape, customers are bombarded with ads across multiple channels—from paid search and display to OTT/CTV and streaming audio. As a result, performance marketing has devolved into a game of attribution, focusing on whether an action occurred after an ad was served. This has largely been driven by platforms like Google and Meta, prioritizing their own attribution models to capture the lion’s share of ad dollars, and by marketers eager to show results.
While attribution can show whether an action occurred after an ad was served, it fails to answer the crucial question: Did this ad actually cause the action, or was it just along for the ride?

Enter incrementality analysis. By comparing a test group (exposed to a new campaign, publisher, creative, or other variable) with a control group (unexposed), you can measure the true lift in media performance caused by a specific variable and separate correlation from causation.
Let’s use a non-marketing example to simplify the concept. Imagine an NBA team with two players who each make 40% of their free throws. To improve performance, the team hires a shooting coach to work exclusively with one of the players, Player B. Both Players A and B are told to maintain all other factors, like gym time, diet, and training routines.
2024-25 Season:
Player A: 40% of free throws ┃ Player B: 40% of free throws

During the 2025-26 season, Player B’s free throw percentage improves to 80%, while Player A’s performance naturally rises to 50%. Both players improved, but Player B improved more. So, how do we measure the shooting coach’s impact?
2025-26 Season:
Player A (control): 50% of free throws ┃ Player B with Coach (test): 80% of free throws

We calculate two metrics to measure the impact:
1. Incremental Lift: After introducing the shooting coach, how much more likely is Player B to make a foul shot?
Formula:
(test: 80% – holdout: 50%) / holdout: 50%
The result is 60%
A 60% lift means Player B was 1.6 times more likely to make a free throw after working with the shooting coach.

60% more likely to make a free throw
2. Incrementality: What percentage of Player B’s improvement is attributable to the shooting coach?
Formula:
(test: 80% – holdout: 50%) / test: 80%
This result is 37.5%
Incrementality reveals that 37.5% of Player B’s improved free throw performance is directly due to the new coach, while the remaining improvement stems from other factors.
Now, let’s apply this concept to advertising. Imagine a brand running search and social media campaigns, both yielding a conversion rate of 0.1%.
The brand has a hypothesis: Adding OTT/CTV advertising to its media mix will increase the conversion rate.

To test this, the brand introduces OTT/CTV ads to one audience subset (test group) while keeping the other subset as a control (search and social). At the end of the campaign:
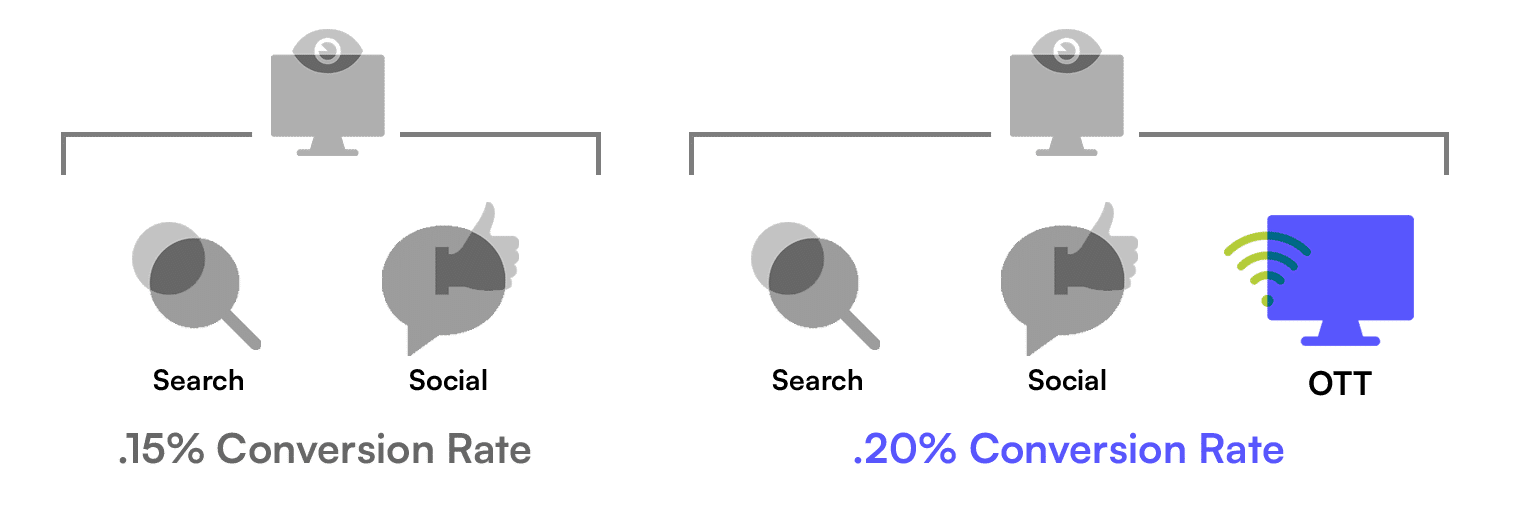
Using incrementality analysis, we can calculate:
(test: .2% – control: .15%) / control: .15% = 33.33% (1.33x)
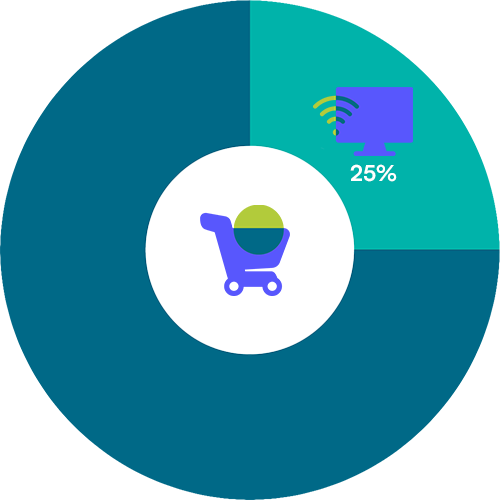
(test: .2% – holdout: .15%) / test: .2% = 25%
This means OTT/CTV ads made the test group 33.33% (1.33x) more likely to convert and were directly responsible for 25% of conversions.
Incrementality analysis allows marketers to isolate and quantify the impact of specific campaign variables, leading to smarter decisions about budget allocation and media strategy. Instead of just tracking performance, you can:
By measuring the true impact of advertising, incrementality analysis helps brands and agencies focus their budgets on the campaigns and publishers that matter most. In the next part of our series, we’ll discuss how to create effective control groups for accurate incrementality analysis. Can’t wait? Speak to a member of our team today.
CTV viewership has exploded. To take advantage of the channel’s surging audience, e-commerce and retail brands are making CTV a key part of their advertising strategy. CTV allows brands to apply an audience-first, data-driven approach to TV similar to other digital channels. However, as ad strategies continue to become more CTV-reliant, brands need greater clarity on performance and ROI. Our proprietary performance CTV platform, Flip, provides that clarity to e-commerce and retail advertisers.
Flip connects mobile location data with CTV ad impressions to help brands granularly understand campaign performance, attribution, and Return on Ad Spend (ROAS). Flip helps advertisers and agencies accurately and granularly measure CTV campaign effectiveness. The platform provides an easy-to-use dashboard that shows CTV buyers exactly which campaigns are working across which devices, publishers, demographics, and more – all in real time. Using proprietary software, Flip can tie ad impressions to app installs, cart amounts, and site visits. The platform can even match a CTV impression to an in-store visit when that device shows up in a physical store, uniquely tying digital impressions to physical actions. With its full-funnel attribution capabilities, Flip traces every CTV impression to a conversion and sheds light on ROAS as CTV investments grow.
“With Flip, we’re able to connect real-world sales events to CTV impressions to let retailers know, definitively, that someone was exposed to their CTV ad, and then visited their site or made a purchase. We’ve set our sights on elevating CTV to a fully accountable performance media channel — driving real-world results for our clients by allowing them to activate against their data or third-party data to maximize return on ad spend. Flip has answered the call for a new benchmark for measuring campaign success, even on platforms that don’t have a lot of transparent reporting, and we’re thrilled to extend it to e-commerce and retail brands.”
– Head of Activation at Agency Partner
Flip is the cornerstone of our full CTV/OTT offering, helping digital ad buyers optimize targeting, tracking, and campaign management across multiple platforms and devices. Now, e-commerce and retail clients can leverage and unlock real-time insights, measure the true impact of campaigns and optimize to drive results. With Flip, e-commerce and retail marketers can:
“As the industry aims to keep pace with consumer demand for personalized experiences in an economic environment where every dollar counts, measurement and performance have become critical metrics for retail advertisers. We’re ecstatic to extend Flip’s capabilities in the retail and e-commerce sector and remain committed to providing a holistic solution by which advertisers can unlock and optimize real-time insights, measure campaign effectiveness, and drive valuable results.”
– Matt Sotebeer, Chief Strategy Officer at Digital Remedy
To learn more about Flip, visit www.digitalremedy.com/flip or speak to one of our team members to book a demo and see the platform in action.